The pursuit of health and wellness has increasingly migrated online, with millions accessing online platforms for fitness guidance and support.
To understand this digital shift, we conducted a comprehensive study. Our analysis of the 50 most visited fitness websites, which collectively drew over 2.2 billion visits in 2023 alone, reveals key trends in how people interact with the online fitness space from 2019-2023.
The top fitness websites saw 31.68% traffic growth in the past 5 years, showing rising global commitment to fitness. We analyzed their digital footprint across training tutorials, supplements, community forums, and others.
This study provides an insightful map, tapping into the pulse of today’s fitness enthusiasts and offering industry insiders the opportunity to leverage their digital audience more effectively.
[ez-toc]
Key Findings
- Traffic Growth: There was a 31.68% increase in visits to online fitness websites (top 50), rising from 1.5 billion in 2019 to 2.2 billion in 2023, signaling robust growth in digital fitness engagement.
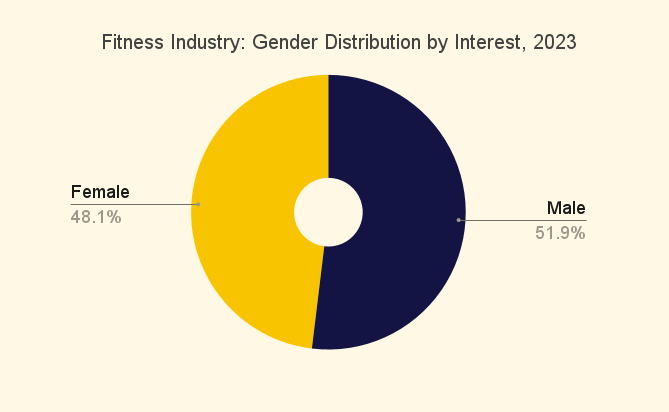
- Gender Distribution: The audience is almost equally divided by gender, with males making up 51.92% (1116.6M visits) and females 48.08% (1034.0M visits), showing widespread fitness interest across genders.
- Geographical Interest: The United States leads with 1274.9M visits (54.37%), followed by the United Kingdom at 196.0M visits (8.36%), and Canada with 107.1M visits (4.57%), reflecting where the most engaged fitness audiences reside.
- Seasonal Trends: Visitor numbers surge in January and decline in August, likely due to New Year’s resolutions and summer holidays, respectively.
- Category Popularity: The top categories are Training with 488.0M visits (23%), Diets and Supplements at 361.6M visits (17%), and Fitness Blogs with 329.5M visits (15%), indicating the most sought-after content in the fitness domain.
50 Most-Visited Fitness Websites, 2023
Fitness Industry: Online Traffic Growth in the Past 5 Years
Reflecting the pulse of the fitness industry’s online engagement, the aggregated traffic of the top 50 most visited fitness websites offers a clear indicator of the sector’s expansion.
Between 2019 and 2023, these websites saw a collective increase in visits by 31.68%, escalating from 1.5 billion to an impressive 2.2 billion.
These patterns underline seasonal shifts, holiday periods, and New Year resolutions significantly shaping fitness engagement, showing a rise in digital fitness activity from the year’s start, reaching its peak during summer. This activity slightly declines as the year ends, only to surge once more with the arrival of the New Year.
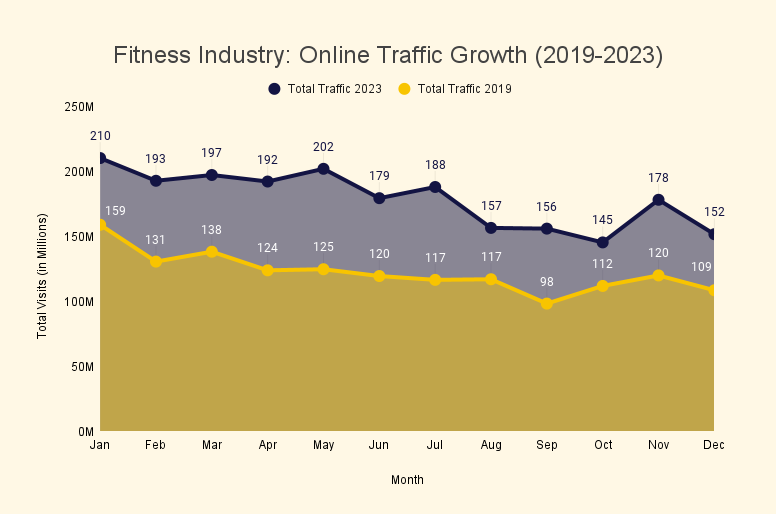
January:
The spike from January 2019 to January 2023 aligns with New Year resolutions, where fitness goals are at their peak., Traffic increased from 159 million to 210 million, a rise of 51 million visits, showing a 24.39% growth rate.
February:
Traffic in February grew from 131 million in 2019 to 193 million in 2023, a surge of 62 million visits, which is a 32.24% increase. The trend suggests sustained motivation from New Year’s resolutions.
March:
From March 2019 to March 2023, visits escalated from 138 million to 197 million, marking a 59 million visit boost, translating to a 29.90% growth. The arrival of spring likely encourages more people to focus on fitness.
April:
Visits in April blossomed from 124 million in 2019 to 192 million in 2023, an impressive 68 million increase, achieving a 35.52% growth rate. This reflects a continued springtime push for fitness before summer.
May:
May saw visits climb from 125 million to 202 million from 2019 to 2023, an increase of 77 million visits, the highest growth at 38.23%. The rush to get in shape for summer drives this peak in visits.
June:
In June, traffic rose from 120 million to 179 million, a 60 million visit jump, reflecting a 33.37% increase. The trend continues as summer fitness routines are well underway.
July:
July traffic heated up from 117 million in 2019 to 188 million in 2023, with a 71 million visit increase, equating to a 37.98% growth. The height of summer often brings the highest motivation for fitness activities.
August:
From August 2019 to August 2023, visits went from 117 million to 157 million, a growth of 39 million visits, or 25.22%. The slight dip might indicate the beginning of a cooldown period as summer ends.
September:
September experienced a return to regular fitness routines as summer break ends and schools resume. Website visits surged from 98 million to 156 million, up 58 million visits, showcasing a 36.95% growth.
October:
October saw a more modest increase from 112 million to 145 million visits, a 33 million visit rise, which is a 23.01% growth rate. This could reflect a transitional period into autumn, where outdoor activities decrease.
November:
Visits in November increased from 120 million in 2019 to 178 million in 2023, a 58 million visit increase, indicating a 32.64% growth. The upcoming holiday season may motivate people to get in shape before the festivities.
December:
December’s traffic, notably grew from 109 million to 152 million, a 43 million visit boost, translating to a 28.41% growth rate. The spike reflects a mix of early New Year’s resolution setters and those aiming to stay active during the holiday season.
Fitness Industry: Website Visits by Category, 2023
Delving into the digital domain of fitness, we examined over 26,000 top web pages from the 50 most visited fitness websites of 2023 and categorized them to understand the key areas of interest.
By tagging each page under one of eight distinct fitness-related categories, we’ve mapped out a detailed landscape of user engagement. This effort provides a granular look at what captivates those dedicated to fitness.
These findings are crucial, offering fitness brands and stakeholders the opportunity to fine-tune their products and marketing approaches to align closely with the varied preferences of their audience.
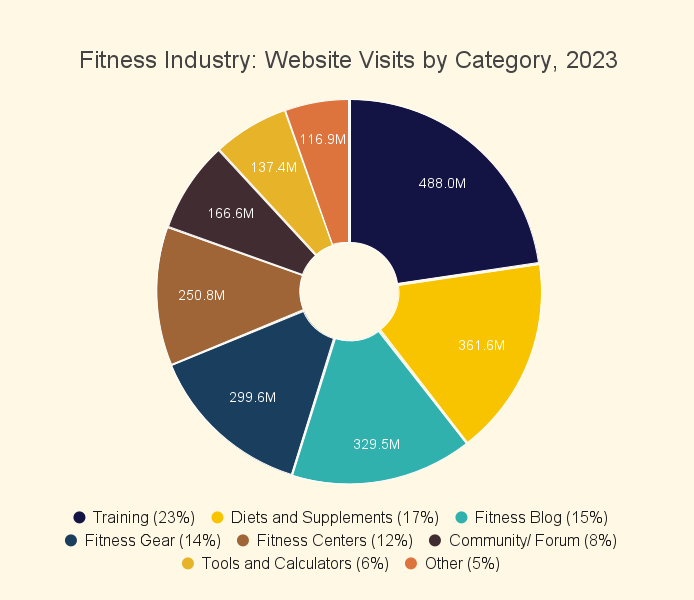
Training (23%):
In 2023, the training category commanded the spotlight with 488 million visits worldwide, underscoring a global drive towards varied and accessible fitness regimens. This sector, encompassing e-fitness and online workout tutorials, stood out, reflecting a significant preference for dynamic and at-home fitness solutions.
Diets and Supplements (17%):
Diets and supplements pages attract 361.6 million visits (17%), reflecting a keen interest in nutritional information and supplement shopping. This number also highlights the growing awareness of diet’s role alongside physical training in achieving fitness goals.
Fitness Blog (15%):
With 329.5 million visits, the fitness blog category indicates a strong appetite for in-depth fitness knowledge. Users are not just looking for quick tips but are investing time into understanding the science and lifestyle behind fitness, demonstrating the value of quality, informative content.
Fitness Gear (14%):
Nearly 300 million visits to fitness gear-related pages indicate extensive research and comparison by consumers, who are likely looking for the best products to enhance their fitness journey. The wide array of options and the detailed decision-making process show how integral gear and accessories are to fitness enthusiasts.
Fitness Centers (12%):
Brick-and-mortar gyms and fitness centers garnered 250.8 million visits, accounting for a 12% contribution. It confirms that users extensively research before committing to a gym membership, emphasizing the importance of location, facilities, and community in their fitness routines.
Community/Forum (8%):
Online fitness forums and communities, although small in page count, pulls in 8%, accounting for 166.6 million visits. This exceptionally active participation underlines the importance of social support and shared experiences in the fitness journey, proving that fitness is as much a communal activity as it is a personal one.
Tools and Calculators (6%):
Tools and calculators draw 137.4 million visits (6%), showcases users’ dedication to monitoring their progress, indicating a proactive approach to fitness that emphasizes measurable outcomes.
Other (5%):
The ‘Other’ category, with 116.9 million visits, captures a broad spectrum in the fitness domain, hinting at niche interests and activities beyond traditional categories.
Top 10 Countries With the Most Fitness Interest, 2023
In today’s health-conscious era, understanding the fitness inclinations of different nations offers key insights. Our study ranked the top 10 countries demonstrating the highest engagement with the top 50 fitness websites in 2023.
By normalizing total website visits with the population size, we established a fair comparison to determine the relative fitness interest per 100K people per year.
In today’s health-conscious era, understanding the fitness inclinations of different nations offers key insights. Our analysis spotlighted the top 10 countries leading in engagement with the foremost 50 fitness websites in 2023.
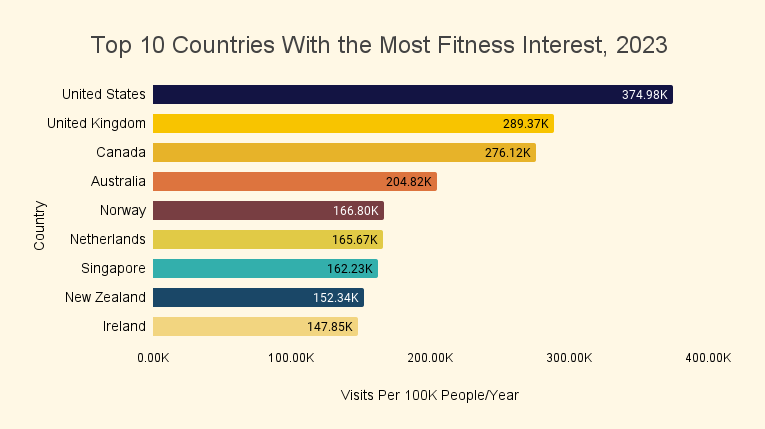
#1. United States (1,274.9M visits):
In 2023, the U.S. topped the chart with 1.27 billion visits or about 106 million visits each month to the top 50 fitness sites. This translates to nearly 375,000 visits for every 100,000 Americans annually, showcasing a nation deeply invested in fitness.
#2. United Kingdom (196.0M visits):
The UK secured the 2nd spot, with 196 million visits throughout the year, averaging 16.3 million monthly visits. This equates to 289,000 visits per 100,000 Brits annually, reflecting a strong fitness culture.
#3. Canada (107.1M visits):
Canadians logged 107.1 million visits, with a monthly average of 8.9 million. The annual rate of 276,000 visits per 100,000 people highlights Canada’s enthusiasm for fitness and the outdoors.
#4. Australia (54.2M visits):
Australia contributed 54.2 million visits, or 4.5 million monthly. With over 204,000 visits per 100,000 Australians each year, it’s clear that fitness and outdoor life are central to Australian culture.
#5. Norway (9.1M visits):
Norway generated 9.1M visits, averaging 758.3K monthly. Its 166.80K visits per 100K people annually indicates a society valuing physical health, likely driven by outdoor activities and government policies.
#6. Netherlands (29.2M visits):
The Netherlands recorded 29.2 million visits, around 2.4 million monthly. Annually, there are 165,670 visits for every 100,000 Dutch, showcasing a nation that values active living and physical health.
#7. Singapore (9.8M visits):
Singapore tallied 9.8M visits, or roughly 816.7K monthly. A per capita rate of 162.23K visits annually suggests a high interest in fitness, supported by urban wellness initiatives.
#8. New Zealand (8.0M visits):
New Zealand’s 8.0M visits, averaging 666.7K monthly, with 152.34K visits per 100K people annually, mirror its engagement with nature and fitness.
#9. Ireland (7.5M visits):
Ireland garnered 7.5 million visits over the year, roughly 625,000 monthly, leading to 147,850 visits per 100,000 Irish annually, showcasing an emerging fitness culture.
#10. Lebanon (7.4M visits):
Lebanon reached 7.4M visits in 2023, with monthly averages of around 616.7K. The 139.09K visits per 100K people annually demonstrate resilience and a focus on health, despite facing challenges.
Fitness Industry: Gender Distribution by Interest, 2023
In 2023, the distribution of online fitness content visits was closely split between genders, with males accounting for 51.92% and females at 48.08% of the total 2.2 billion visits. This demonstrates a universally high level of interest in fitness across both genders.
Methodology
Our methodology for analyzing the fitness industry’s online engagement involved a multi-faceted approach:
Website Traffic Analysis: We utilized SEMrush to monitor and aggregate the total visits to the top 50 most visited fitness websites over five years, from 2019 to 2023. This provided a broad view of the industry’s digital traffic trends.
Page Content Categorization: Over 26,000 pages from these websites were categorized based on their content into eight distinct categories, ranging from training and supplements to community forums and fitness gear.
Geolocation Identification: We identified the geographical source of the website traffic, enabling a country-specific analysis of fitness interest.
Gender Segmentation: Traffic data was also segmented by gender, providing insight into the distribution of fitness interest between male and female audiences.
Per Capita Calculation: To account for differences in country populations, we normalized the data by calculating visits per 100,000 people, offering a fair comparison of fitness interests across nations.
Trend Observation: Seasonal traffic trends were observed, allowing us to identify peak periods of fitness interest throughout the year.
Data Synthesis: All collected data points were synthesized to draw out key insights and trends, which were then used to inform our findings on the state of the digital fitness industry.
This methodology ensured a comprehensive and objective analysis of the fitness industry’s digital behavior and allowed us to quantify the interest in fitness across different demographics and regions.